Daily Trojan Staff Diversity Report shows increased representation
Since Fall 2020, the Daily Trojan staff has completed a semesterly internal survey to evaluate the demographics and identities of the student journalists dedicated to represent the University. The survey results allow us to better recognize how our staff demographic and related reporting translate into a collaborative workspace with equity and inclusivity.
Methodology
Staff was given multiple weeks to complete a brief survey. It was distributed in the latter half of the semester such that those who left early on or were largely uninvolved — and thus did not truly represent our staff — would not be included in our rosters. The survey captured a variety of demographic information, including class standing, race/ethnicity, gender identity, sexuality and record of disability in addition to financial aid and occupational statuses. Most sections had a “prefer not to state” option should respondents feel uncomfortable sharing.
Last semester, we added a question inquiring how many semesters individuals have worked for Daily Trojan to measure staff retention and its potential relationship with diversity, equity and inclusivity of the workplace culture and newsroom. With collaboration from our staff development and recruitment director, the survey included a new secondary section that asked the staff whether they would return or not after reflecting on their involvement during the semester. These staff responses will heavily inform newsroom culture and staff development efforts in future semesters.
The Daily Trojan received an 88.31% response rate, our highest ever. The survey received 257 responses out of a staff of 291, which itself decreased from last semester’s 323. Art and Design was the only one of the paper’s 13 sections that had a 100% response rate.
We’ve also stratified the responses into three groups, reflective of our leadership hierarchy: staff, masthead and managing. The masthead consists of all senior editors, directors and managing editors, while the managing team consists of only the editor-in-chief, managing editor, digital managing editor and three associate managing editors. Only 26 of 28 masthead members responded, but all six managing editors replied. These distinctions have not been made for the past two semesters, so trends are unable to be drawn. Still, we feel it is important to track the diversity of the organization’s leadership.
Analysis
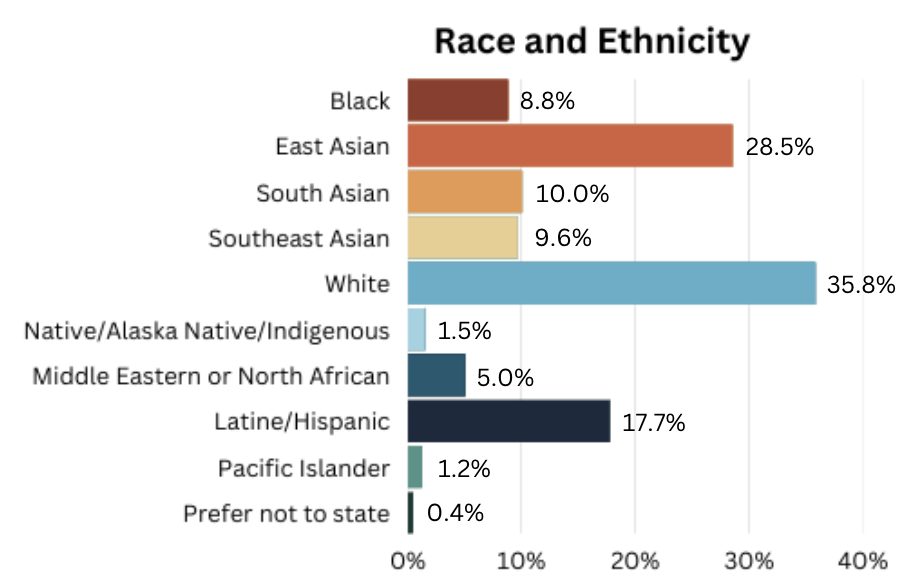
There have been multiple slight increases in the racial and ethnic diversity of our staff from Fall 2022. The most significant increases were observed in East Asian and Native/Alaska Native/Indigenous staffers, respectively constituting 28.5% and 1.5% of staff, compared to last semester’s 25.7% and 0.4%. The masthead, meanwhile, was 32.1% East Asian and the managing team 16.7% East Asian. Neither the masthead nor the managing team had a Native/Alaska Native/Indigenous member.
Other portions of the race/ethnicity makeup remained consistent with previous semesters. Southeast Asian, Pacific Islander and Black representation marginally increased from 9.3%, 0.7% and 8.6% to 9.6%, 1.2% and 8.8%, respectively. The masthead was found to be 10.7% Southeast Asian and 3.6% Black, with zero Pacific Islander members, while the managing team had no members of these groups.
The staff experienced slight decreases in South Asian, Middle Eastern or North African and Latine/Hispanic journalists by 0.4%, 0.4% and 0.5% from Fall 2022 to 10%, 5% and 17.7%, respectively. The masthead was found to consist of 3.6% South Asian, 7.2% Middle Eastern or North African and 21.5% Latine/Hispanic editors. Of these groups, the managing team had only 16.7% Latine/Hispanic representation.
While white representation on staff noticeably decreased by 3.5%, white staffers continue to represent the largest ethnic group with 35.8%. On the masthead, 39.3% of editors identified as white, including 83.3% of the managing team.
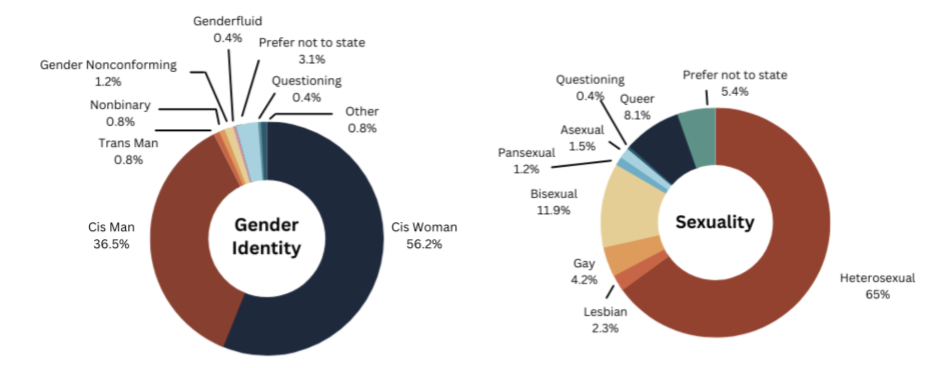
The staff largely consists of cisgendered individuals, accounting for 92.7% of the staff, with the cis men and women breakdown remaining consistent with last semester at 36.5% and 56.2%, respectively. There were slight increases in trans men, gender fluid and gender nonconforming individuals and a decrease in nonbinary people. On the masthead, 53.9% of editors identified as cis women and 38.5% as cis men, and 3.8% each as gender nonconforming and nonbinary. On the managing team, 50% were cis women, 33.3% were cis men and 16.7% gender nonconforming.
Although still representing the majority at 65%, the heterosexual percentage decreased by 3.6% from last semester. Conversely, queer representation increased from 5% to 8.1%. Lesbian, gay, pansexual and asexual percentages slightly rose while bisexual representation faintly dipped. Among the masthead, 53.9% were heterosexual, 7.7% were gay, 19.2% were bisexual and 11.5% were queer. Members of the managing team identified as 50% heterosexual, 33.3% bisexual and 16.7% queer.

Just over 16% of our staff reported having a disability or a record of it, while the majority of staff reported being non-disabled. In contrast, 30.8% of the masthead reported having a disability or history of disability, including 33.3% of managing.
With regard to class standing, sophomore and freshman classes shared the same percentage of 32.7%, with the freshman cohort seeing a great increase from last semester’s 23.2%. The junior and senior classes decreased by 6.2% and 4.4%, respectively, from last semester, but the graduate cohort experienced a 1.6% increase. A substantial 41.5% of staff is new, while 31.2% of staff are in their second semester in Daily Trojan, suggesting considerable success in staff recruitment and retention. On the masthead, freshmen constituted 7.7%, sophomores 38.5%, juniors 30.8% and seniors 23.1%, with no graduate students. The managing team was a further 33.3% each seniors, juniors and sophomores.
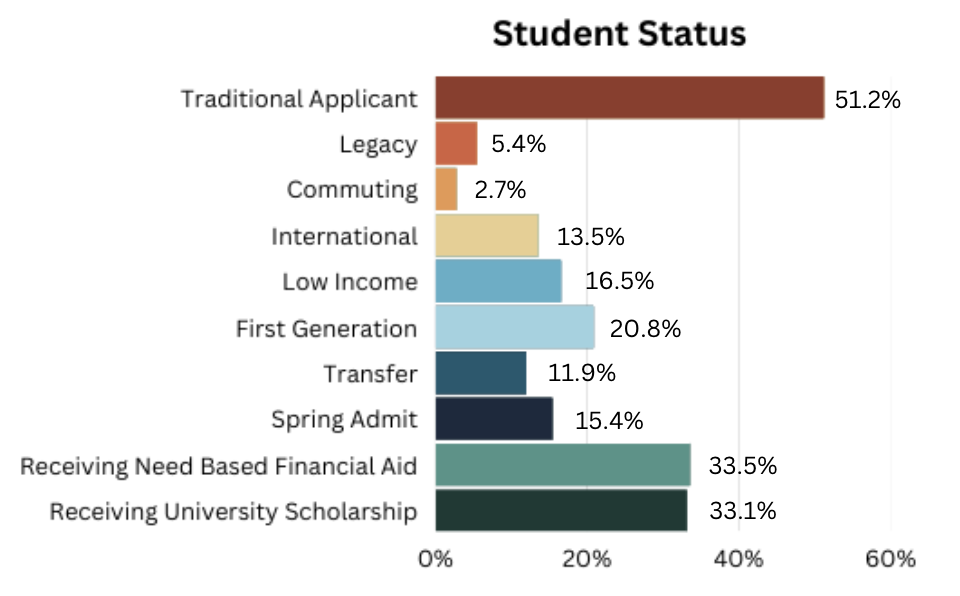
A little over half of our staff are traditional University applicants, and 20.8% of our staff is first generation, which is congruent with last semester. Just over 46% of masthead members were found to be traditional applicants, and 30.8% first generation. On the managing team, only 33.3% were traditional applicants and 50% first generation.
The percentage of low-income students increased from 14.3% to 16.5%; likewise, the percentage of international students increased from 8.6% to 13.5%. These figures for the masthead and managing respectively were 19.2% and 33.3% low-income students and 7.7% and 16.7% international students.

Around 33% of staff is receiving University scholarship and/or need-based financial aid, similar to last semester. Our staff’s occupational status matched that of last semester, with 59.2% working for other jobs outside of Daily Trojan. On the masthead and managing team, the percent of members receiving aid was found to be 61.5% and 50%, respectively, while 57.7% and 66.6%, respectively, worked other jobs.
Semester Recap and Moving Forward
This semester, our staff led a concerted effort to reflect our closely held values of diversity, equity and inclusion in our reporting through our style guide, supplements and special editions.
We updated our style guide to include more culturally relevant language that better reflects and represents the people we report on. Our style guide was developed to commit to people-first language to prioritize the individual before an identifier.
In service to using people-first language, we followed the decision of USC’s Latine Student Assembly to use the term “Latine” instead of “Latinx” for gender-neutral terms ending in “-e” used in some Spanish words. Similarly, in recognition of our proximity and relationship to the South Central community, which is around 75% Hispanic, we published the paper’s first two Spanish language supplements, written by Spanish speakers and focused on coverage pertinent to Spanish-speaking readers. We also published identity-related special editions for Lunar New Year, Black History Month, Women’s History Month and the Day of Silence, in which all stories highlighted nuanced, relevant experiences to these communities.
Similar to last semester, this survey was designed to expand on those of previous semesters and discern new findings related to staff makeup. We believe that diversity and staff retention are intertwined and want to further investigate this link. Future diversity, equity and inclusion directors should work closely with the staff development and recruitment director to reinforce inclusivity within our reporting and culture by organizing outreach and affinity groups within and across sections.