
Fall 2020 Diversity Staff Report

Fall 2020 Diversity Staff Report
Over the course of two months, the Daily Trojan staff filled out an internal survey that had a series of questions related to personal identities. As newsrooms across the country, both professional and student alike, reckon with the lack of intersectionality and representation among their staff, we realized that the Daily Trojan is not and should not be an exception to criticism.
The purpose of our staff report is to, with full transparency, disclose which groups of people are writing about the University’s student body and community. Moreover, the report displays several areas with alarming statistics that demonstrate the Daily Trojan is failing to meet our own standards.
Representation, in all aspects, is vital. When it comes to journalism and news reporting, staff representation ensures that communities are being described by those who know the group the best, not by people who will never understand its lived experiences and multifaceted nuances.
Thus, through this report, the Daily Trojan acknowledges that there are areas in which we are missing important perspectives on our staff. We do not have anyone on staff who identifies as Native American, Indigenous or Alaska Native. We do not have anyone on staff who isn’t cisgender-identifiying. Additionally, we have an overwhelmingly straight newsroom.
This significantly impedes our ability to report on these communities and on so many other groups that makeup the University’s diverse student body.
Our methodology
The diversity staff report covers six areas: class standing, race/ethnicity, gender identity, sexuality, student status and record of disability. These areas were chosen as a means to represent the Daily Trojan newsroom in the most holistic manner possible.
While most of these attributions are common in demographic surveys, we wanted to include student status data to reflect on the varying socioeconomic and educational backgrounds of our staff. Student status includes individuals who identify as one or more of these following traits: international, low-income, first-generation, transfer, spring admit and receiving need-based financial aid. There is an option of “none” for those who did not identify themselves with any of those traits.
More than 200 staffers of the Daily Trojan filled out the internal survey; our Fall 2020 masthead and sports staff were the only sections to have a 100% response rate.
Analysis of the data
Individuals who identify as Middle Eastern or North African, Black or Latinx/Hispanic make up the smallest percentage of the Daily Trojan newsroom, representing 4%, 6% and 9% of our staff, respectively. White people, totaling to 31%, and East Asian or Pacific Islander people, representing 25%, are the two best-represented racial populations of all the staff at the Daily Trojan.
In comparison to USC’s racial demographics for Fall 2020, the Daily Trojan’s staff meets or is near most of these percentages, the exceptions being the proportion of Asian people and Latinx/Hispanic people.
Our editorial staff does not have anyone who identifies as Native American, Indigenous or Alaska Native nor Middle Eastern or Northern African. Only 3% of our editorial staff are Black.
In terms of student status, 34% of our staff indicated that they receive need-based financial aid; 16% of staffers noted they are low-income students. Eighteen percent of our entire staff are first-generation college students and 14% are transfer students.
The majority of our staff are non-disabled people, with only 12% of individuals indicating that they have a disability or have a record of one.
As mentioned earlier, the Daily Trojan does not have any who identifies as transgender, non-binary, gender non-conforming or gender fluid. Our cisgender staff consists of 73% women and 27% men.
A similar ratio of women to men is maintained throughout various sections, with the exception of the sports staff, which is 73% men and 27% women.
Finally, the results for sexual orientation show that the Daily Trojan newsroom is 73% straight. The percentages for all staff who identify as bisexual, pansexual, queer, lesbian, gay or questioning are all under 10%.
Moving forward
These numbers are, unfortunately, far from surprising — nevertheless, they are important details to be cognizant of in the future. In terms of recruitment for next semester, it is our goal for this report to show us which communities need more representation on our staff and which individuals we have historically excluded from our newsroom.
The report shows us that the Daily Trojan is not accessible to individuals from low-income backgrounds; therefore, more work must be done to eradicate any financial barriers that would prevent people from joining our staff. The report also highlights us that our majoritarily non-disabled newsroom can be susceptible to ableist practices, whether implicit or not.
As a historically-white institution, it is imperative that the Daily Trojan commits itself to anti-racist efforts, which includes coming to terms with the privileges that a lot of our members have.
This report will serve as a reminder to the Daily Trojan and all of its staff that a newspaper cannot serve its community well if the newsroom is not reflective of the people it writes about.
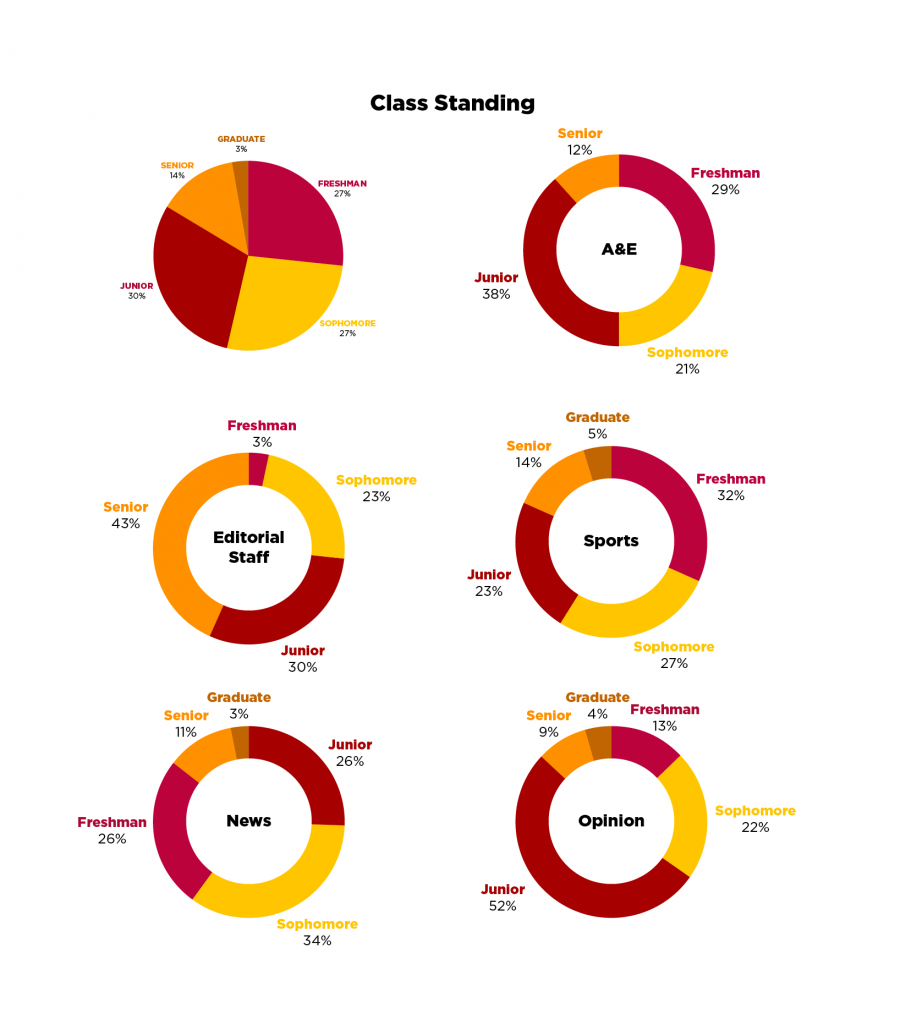
Class Standing
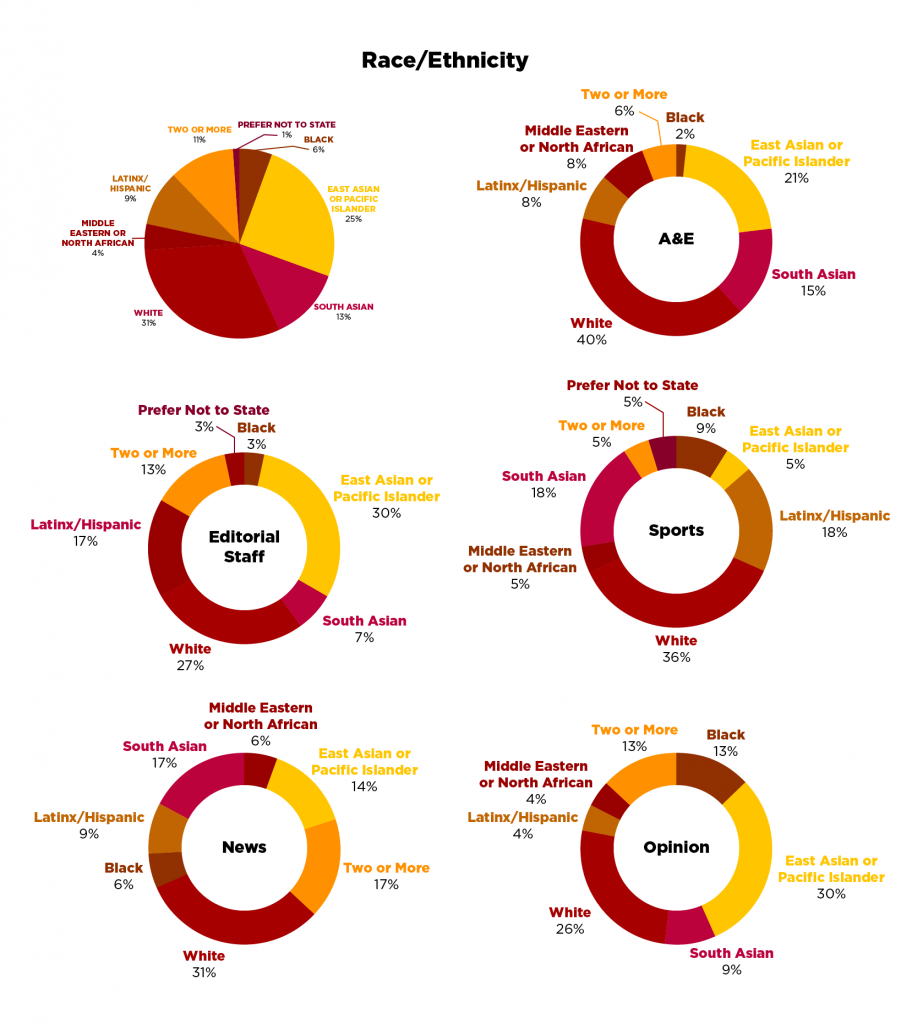
Race and Ethnicity
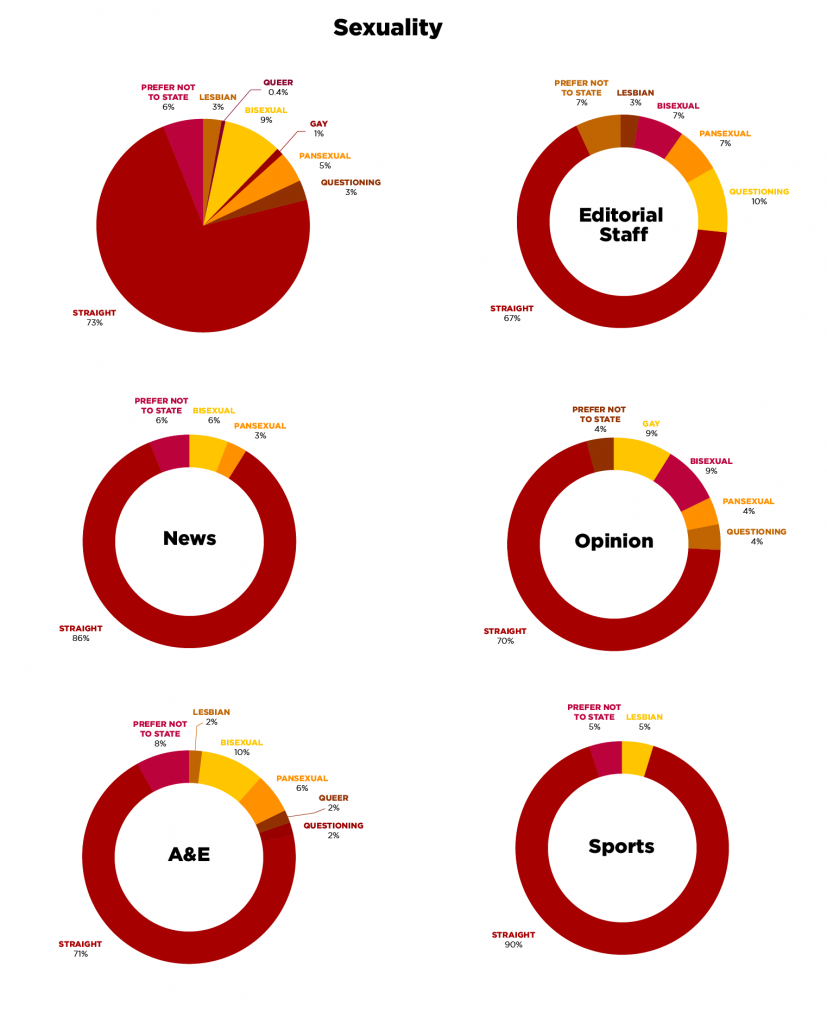
Sexuality
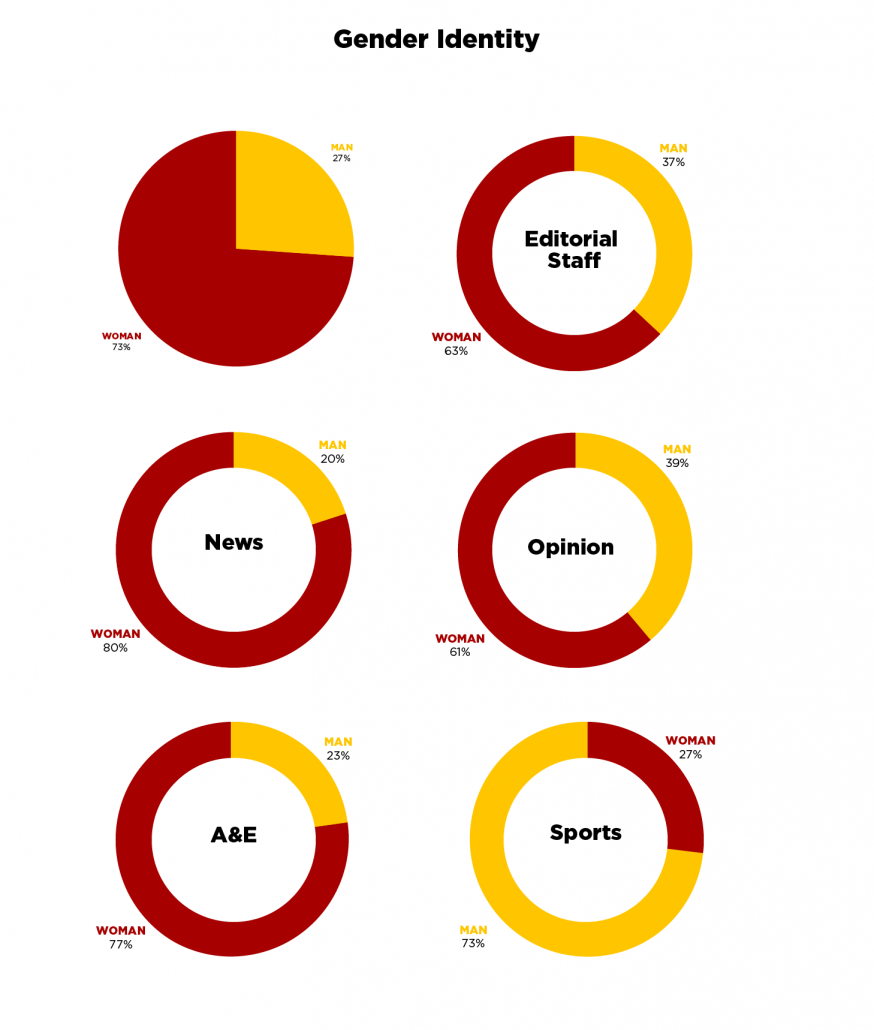
Gender Identity
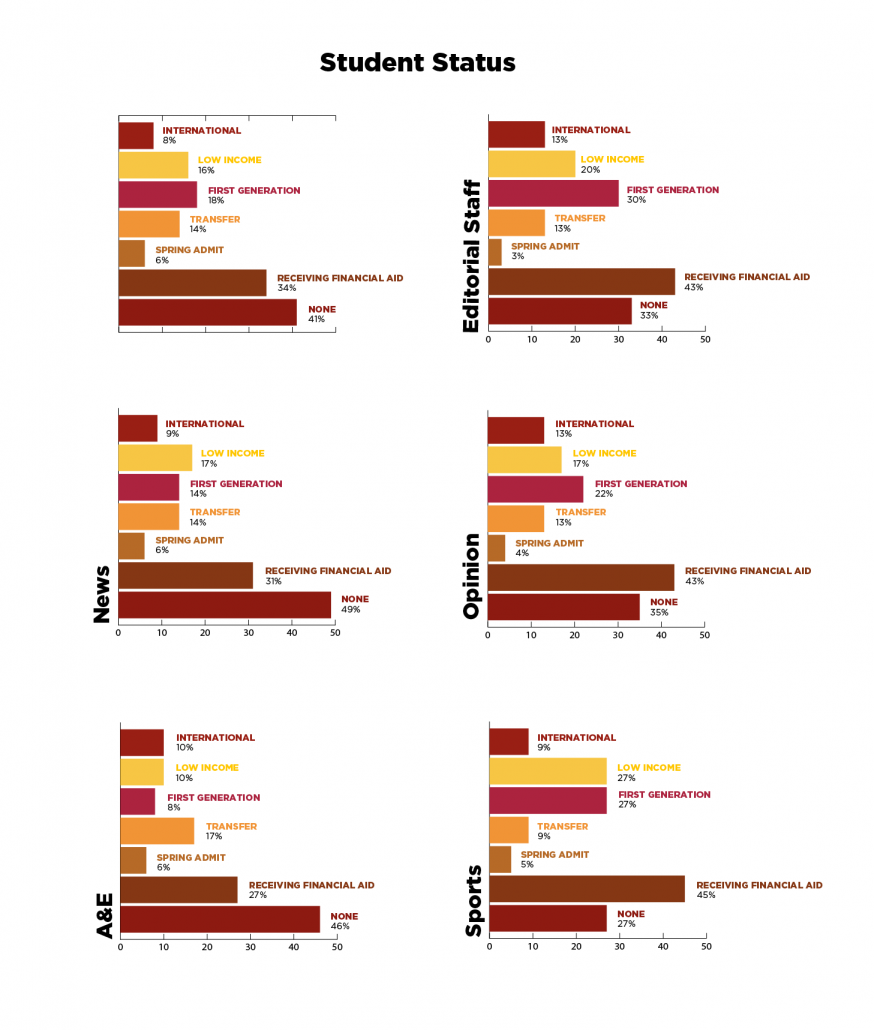
Student Status
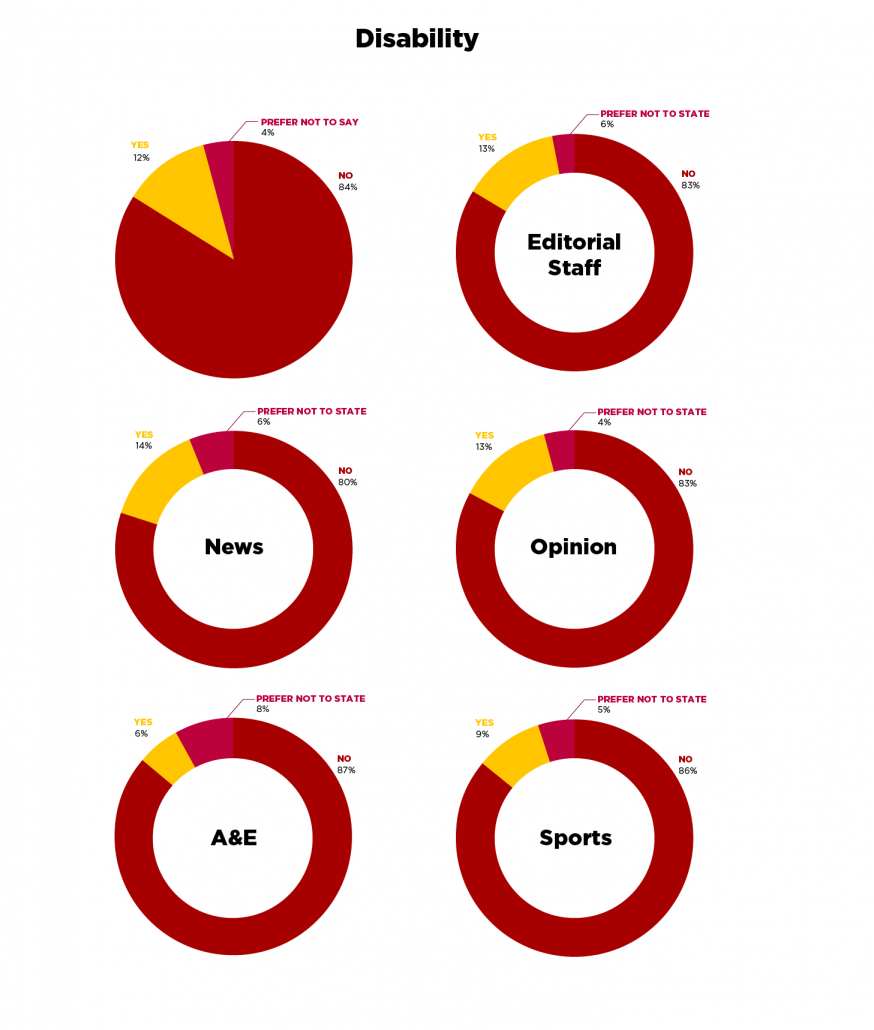
Disability
Design by Melody Chen, Yulia Nakagome and Amandeep Vaish. Data visualization by Stuart Carson, Angie Orellana Hernandez and Raymond Rapada.